Why LotFabric™
What changes when the counts are calculated and every concept arrives ready to present.
Who it fits
A good fit
- Land developers and home builders in North America.
- Low-rise residential sites: ground-oriented product.
- Teams with concepts in CAD, based on product direction.
- Decisions at acquisition, during approvals, or when the market shifts.
- Planning, urban design and engineering firms offering this to their own clients. How partnering works
Not what this is for
- Mid-rise and high-rise sites.
- Engineered, to-scale or approval drawings. The rendered plan is a concept.
Compared with how it's done now
In-house or from a standard takeoff, getting to counts by product and a plan you can present takes longer and costs more.
In-house (CAD and a spreadsheet)
- Counts worked out by hand, block by block.
- Mix found by trial and error.
- Close to a day per concept, plus checking.
- A render is extra: it needs lead time and can be prohibitively expensive.
- Takes your team away from running projects.
- The choice gets made on numbers alone, often without other departments weighing in.
A standard frontage takeoff
- Total frontage by unit category.
- Unit types and target mix are usually outside its scope.
- Timing depends on the firm's workload.
- Delivered as data, to be presented separately.
LotFabric™
- Counts by unit type, every block.
- Target mix and lotting rules built in.
- Frontage optimized across the whole plan.
- Your team stays on its projects.
- Every concept rendered, ready to present.
- 1 to 3 business days.
The counts are calculated, not estimated.
A detached block can accommodate several lot sizes. The real work is finding which combination, across every block, hits your target mix. LotFabric™ solves that mathematically and reports target and result side by side, so where the blocks as drafted pull the mix away from what you asked for, you see it.
- Less frontage left over
- Lotting a block with one lot size leaves a remainder at the end of it. Solving the mix across the whole plan lets each block take the lot sizes that fit it best, so less frontage goes unused. On block P1-050, the calculated mix puts 2.4 m (about 8 ft) more frontage to use than 34' lots alone, and 8.8 m (about 29 ft) more than 38' lots alone. Wasted frontage is lost value. See what that adds up to
- Townhouses as actual blocks
- Each run is made of townhouse blocks within a set range of units, with end units at their own wider width. No average widths.
- Lotting rules
- Products are lotted with their neighbours in mind. Large detached lots are not placed near non-detached product, and the larger, premium lots sit furthest from other product types, in the more premium areas of the plan.
Figures are from Concept A of the sample site: 65 blocks, 8,581 m of net frontage, 71.5 m (under 1%) left over.
12 × 34' Detached, 2 × 38' Detached
The same block with a single lot size
15 × Townhouse 20' as four townhouse blocks: 8 end units and 7 interior units
End unit, 7.8 mInterior unit, 6.1 m
These bars illustrate the calculation for a single block. Lot lines are not drawn on the rendered plan.
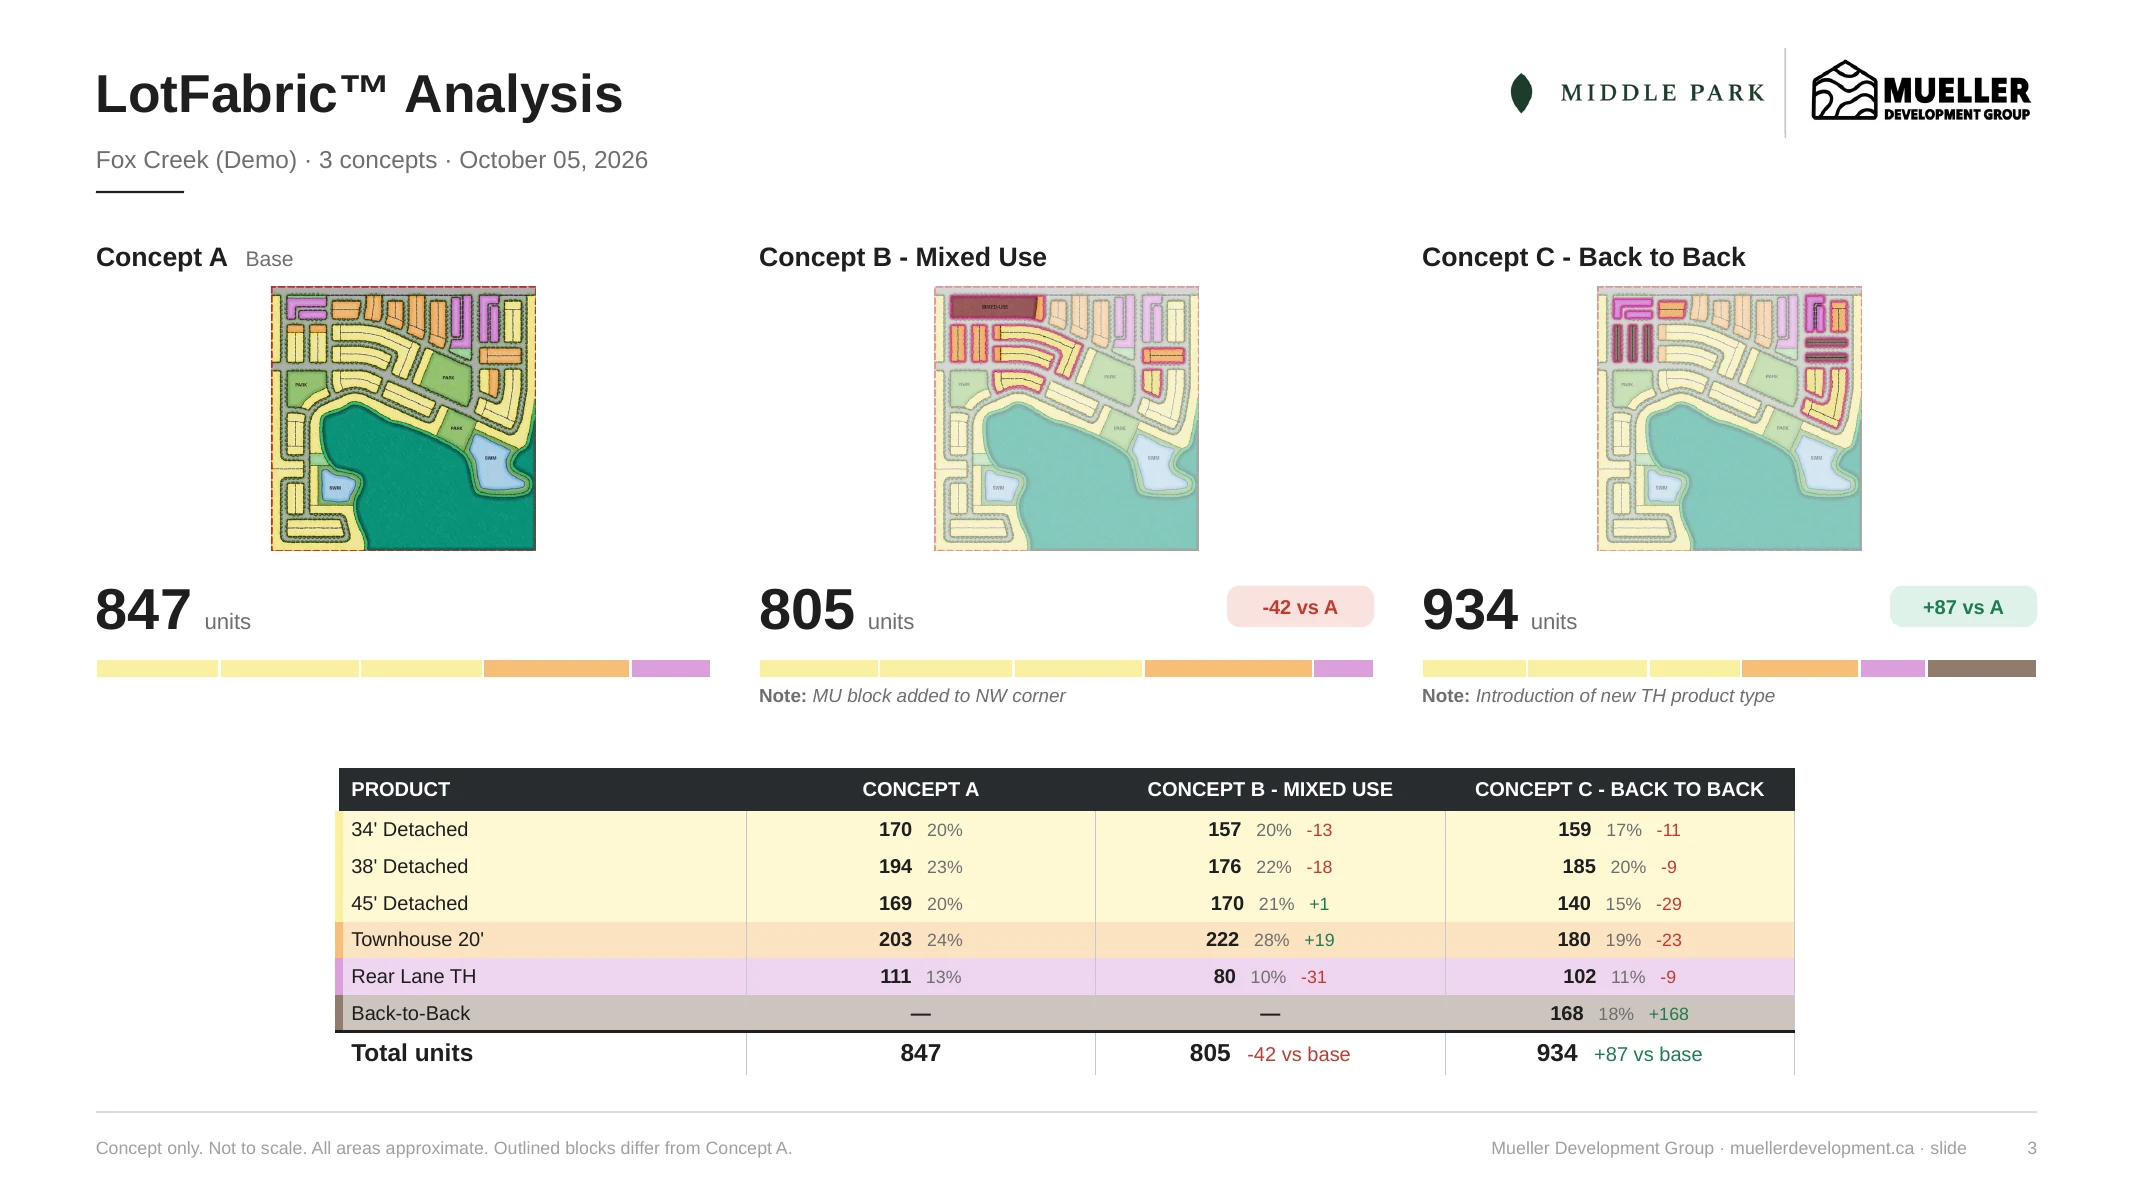
| Product | Target mix | Result | Units |
|---|---|---|---|
| 34' Detached | 20.0% | 20.1% | 170 |
| 38' Detached | 20.0% | 22.9% | 194 |
| 45' Detached | 20.0% | 20.0% | 169 |
| Townhouse 20' | 25.0% | 24.0% | 203 |
| Rear Lane TH | 15.0% | 13.1% | 111 |
| Total units | 847 |
What is exact
The unit counts and the mix. They are calculated against the geometry you supply and the frontages and target mix set in your product library.
What is a concept
The rendered plan. It is an illustration of the concept: not to scale, areas approximate, and not an engineered or approved plan. Lot lines are not drawn on it.
No presentation to build afterwards.
Once the counts are done, someone on your team usually still has to turn plans and data into something they can present. That step is already handled.
The analysis arrives as rendered plans, a summary and a side-by-side comparison, ready to put in front of partners, lenders or a board as delivered. It saves the time that normally comes after the production work is finished.
While we run the analysis, your team stays on the projects it's managing and the next acquisition.
For planning, urban design and engineering firms.
Add concept analysis to what you offer your clients, without adding staff or software. You stay the point of contact, and your client works only with you.