Concept A Base
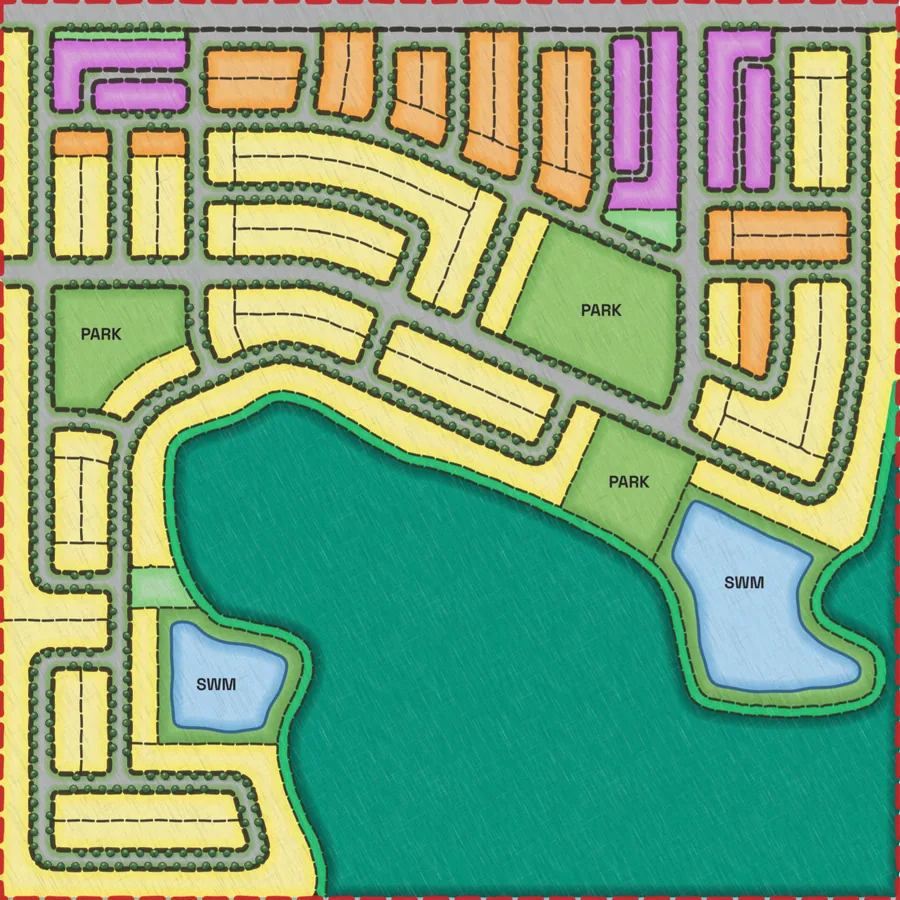
847units
A sample LotFabric™ Analysis. Concept A is the base. Concept B trades a corner for a mixed-use block. Concept C adds back-to-back townhouses.
Your company logo, the site name and the date.
Every concept side by side, with unit counts and product mix.
The rendered plan, the mix breakdown, and a map of what changed against the base.
The base concept arrived as block outlines. It came back as 847 units across five product types, at 99% frontage yield.
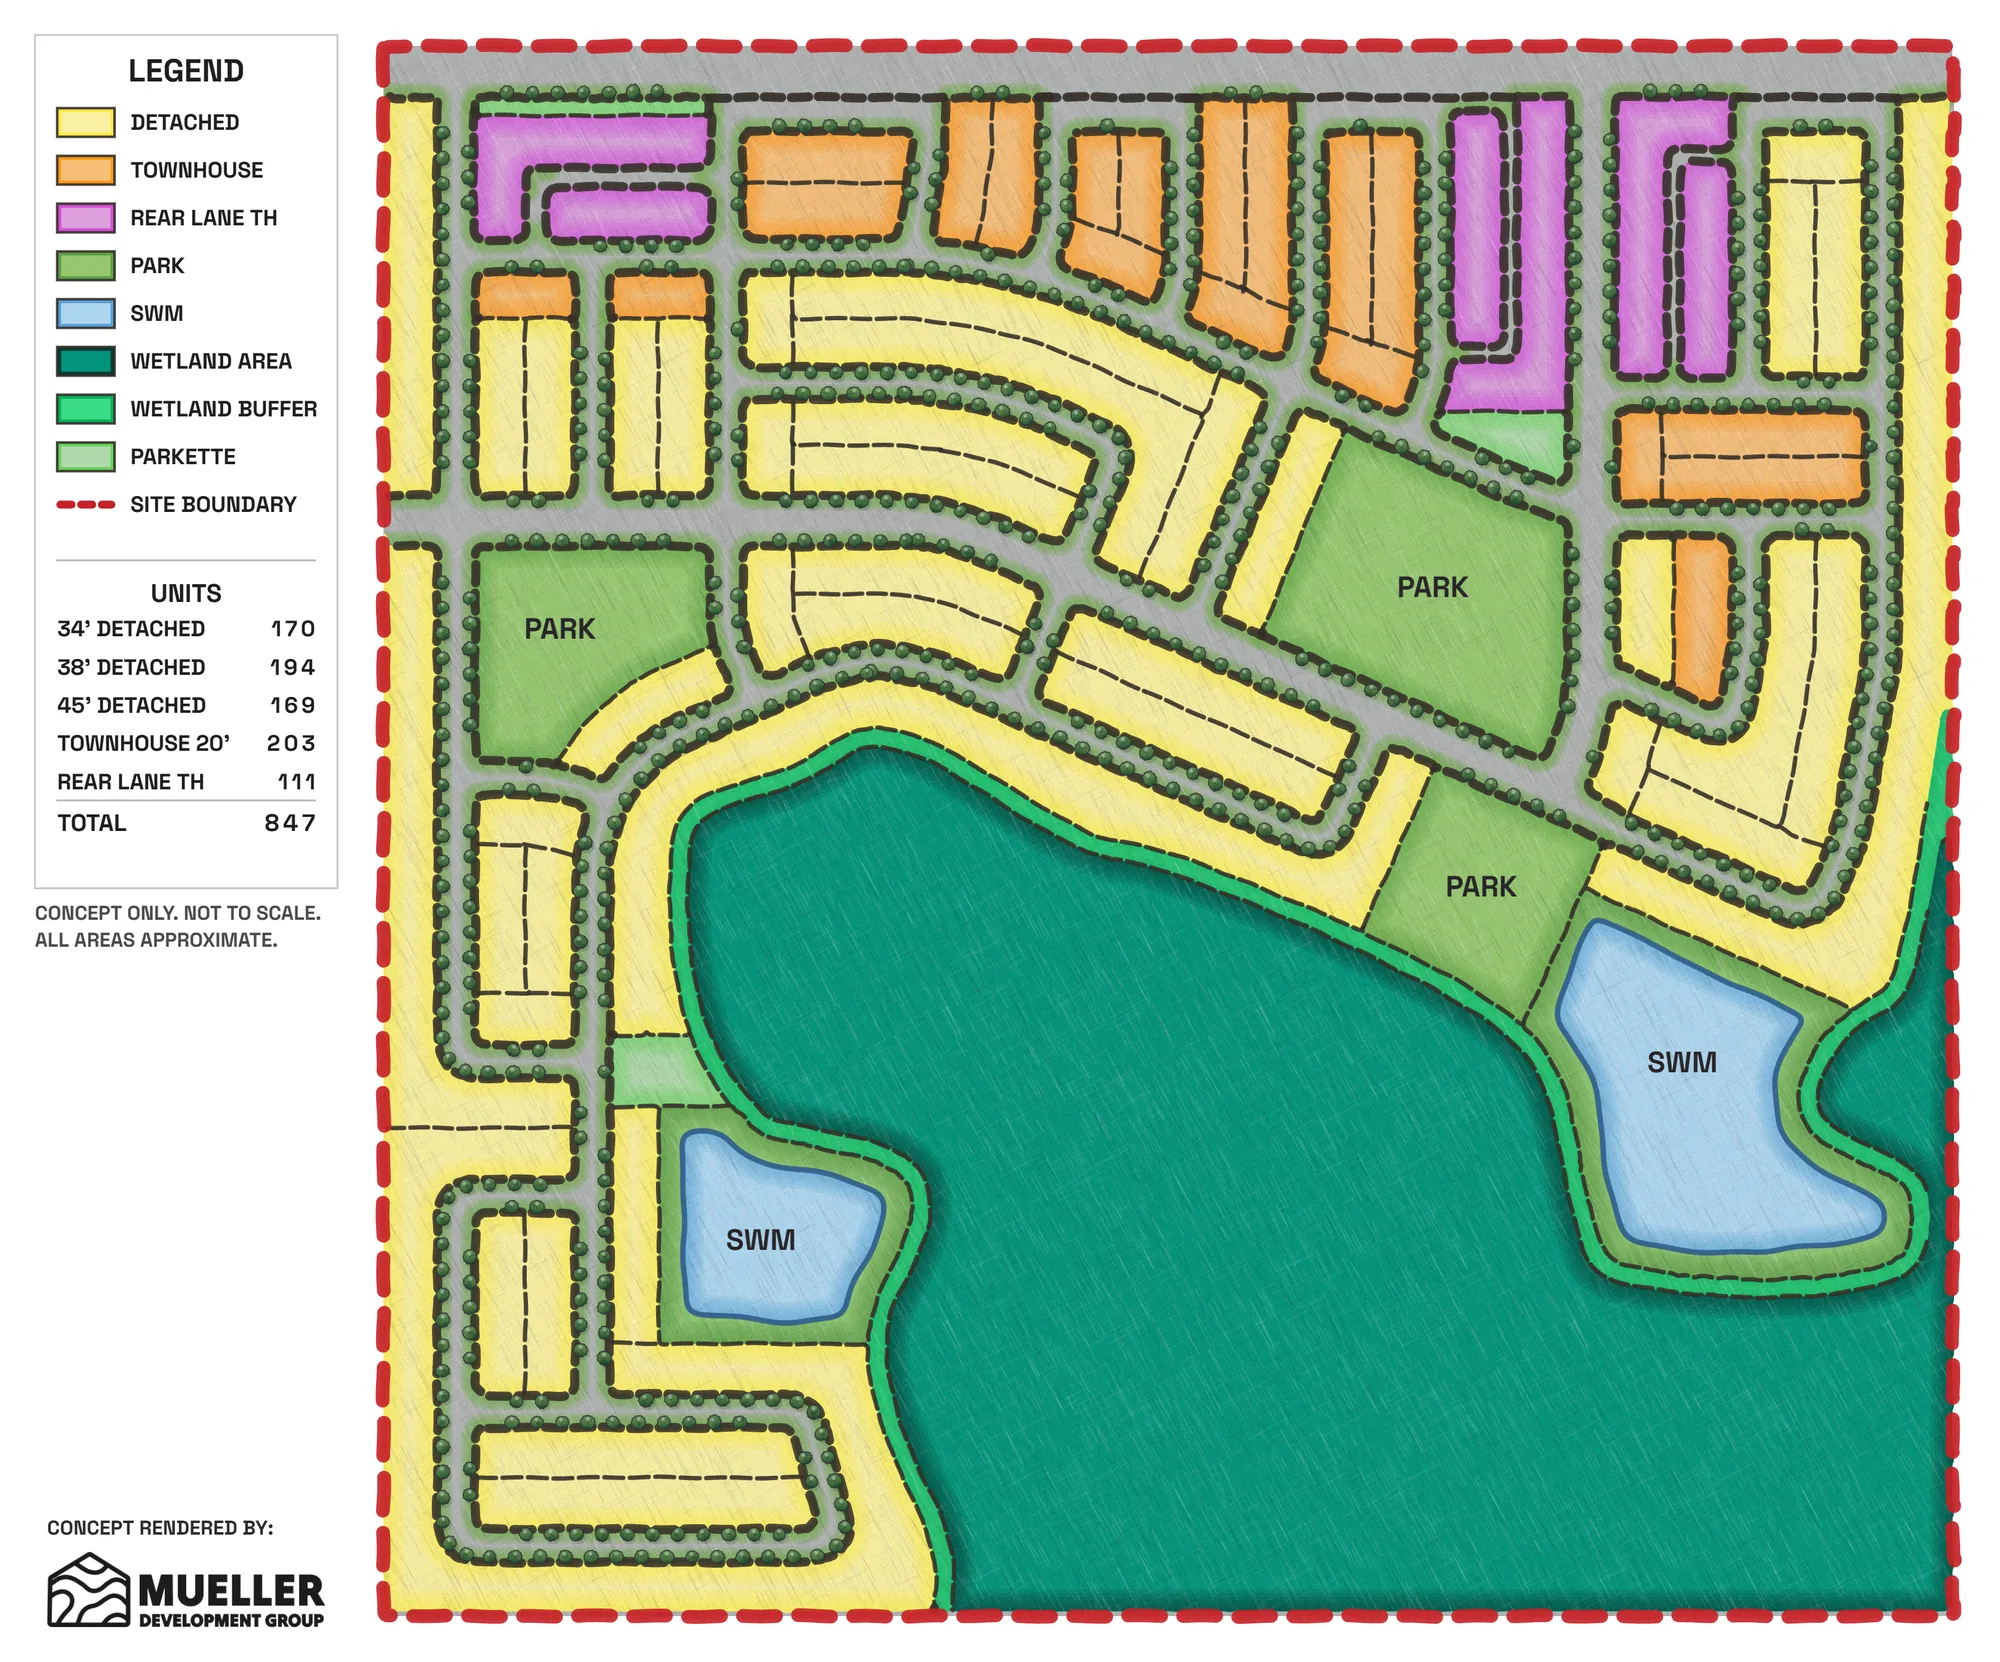
Unit counts and product mix for every concept, with the difference from the base.
847units
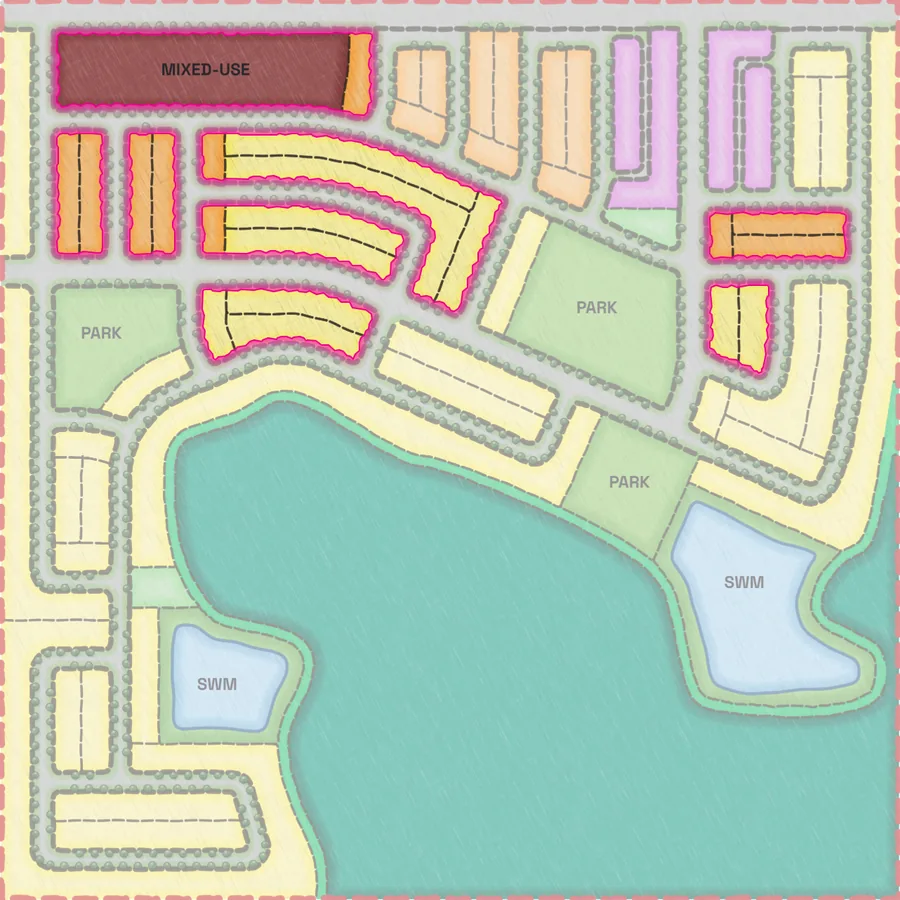
805units−42 vs A
Note: MU block added to NW corner
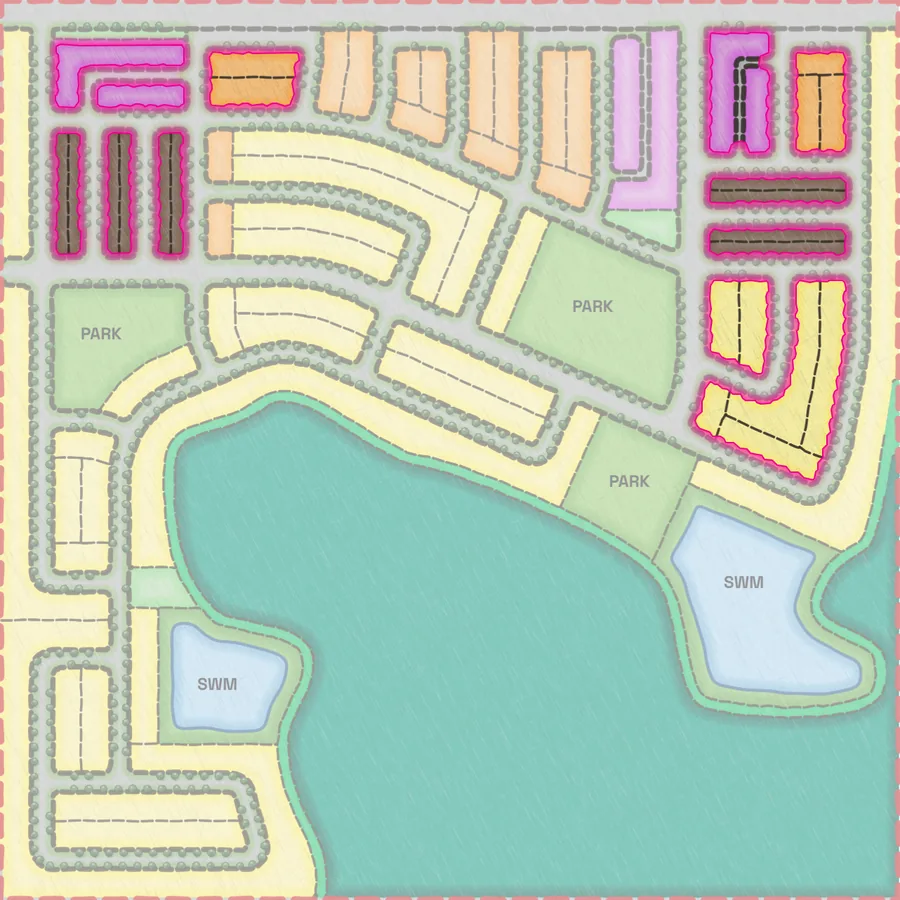
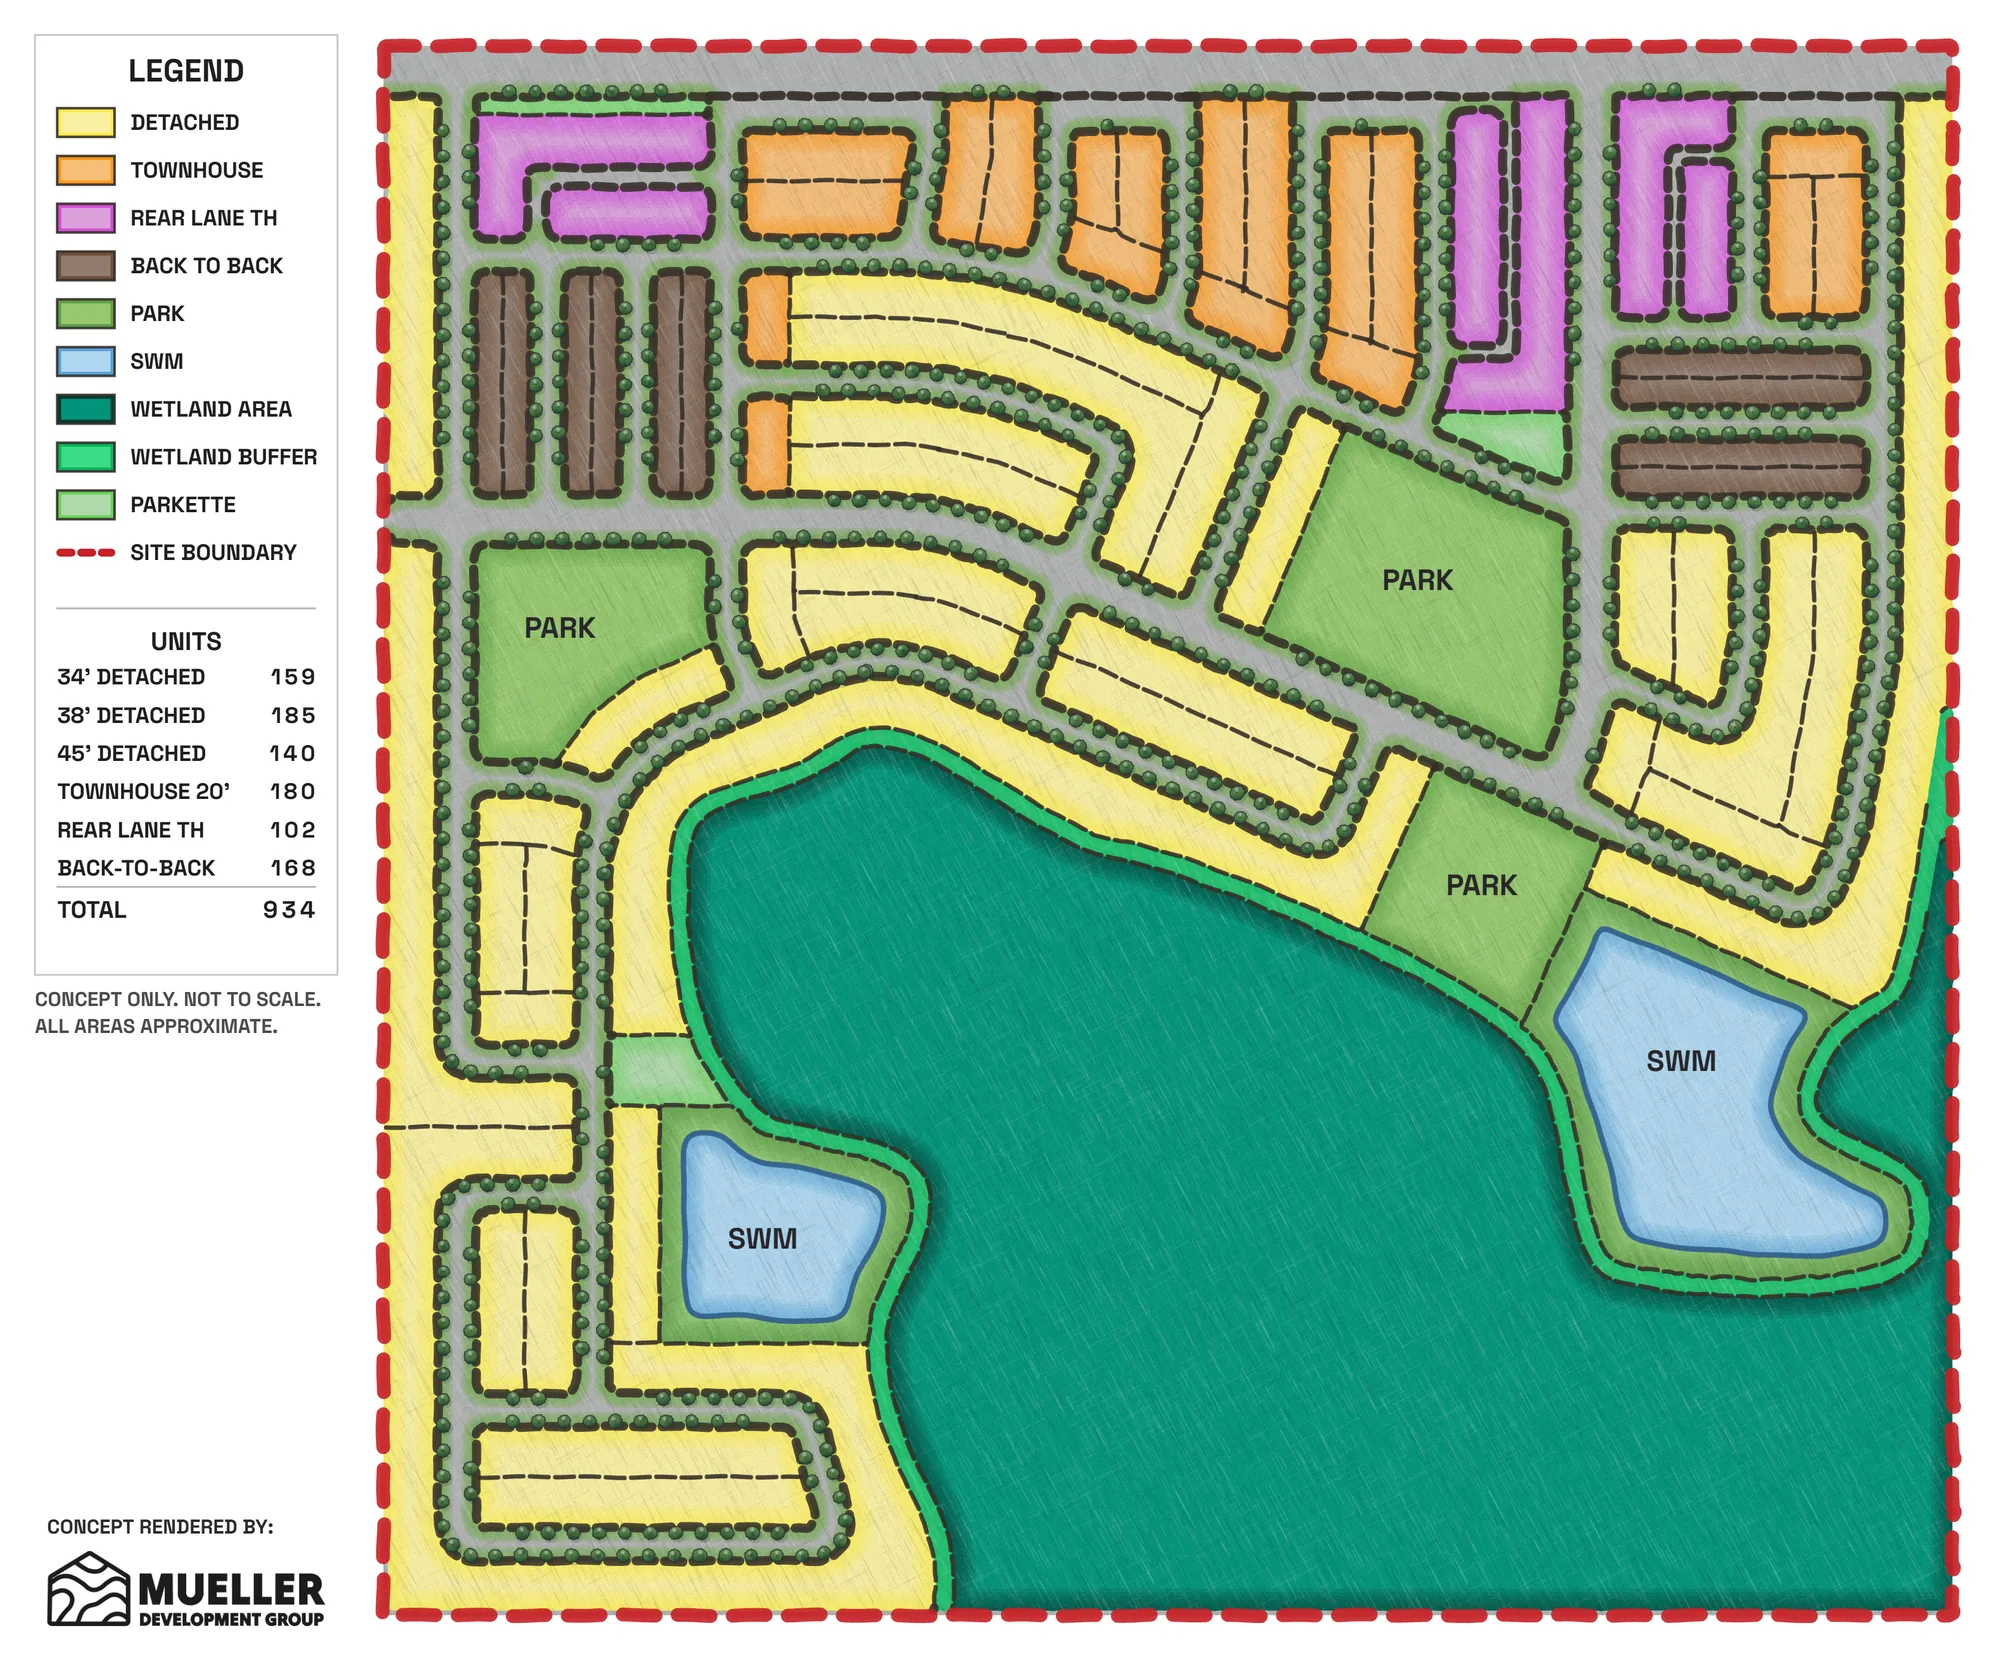
934units+87 vs A
Note: Introduction of new TH product type
| Product | Concept A | Concept B | Concept C | |||||
|---|---|---|---|---|---|---|---|---|
| 34' Detached | 170 | 20% | 157 | 20% | −13 | 159 | 17% | −11 |
| 38' Detached | 194 | 23% | 176 | 22% | −18 | 185 | 20% | −9 |
| 45' Detached | 169 | 20% | 170 | 21% | +1 | 140 | 15% | −29 |
| Townhouse 20' | 203 | 24% | 222 | 28% | +19 | 180 | 19% | −23 |
| Rear Lane TH | 111 | 13% | 80 | 10% | −31 | 102 | 11% | −9 |
| Back-to-Back | – | – | 168 | 18% | +168 | |||
| Total units | 847 | 805 | −42 | 934 | +87 | |||
Each concept also comes as an Excel workbook of the block-by-block evaluation: frontage, lots by product and leftover frontage for every block.
It is a real Excel file with live formulas, ready to use in your proforma. Area breakdowns, ROW takeoffs and revenue analysis are available as extras.
| Block | Gross (m) | Corners | Net (m) | 34' Detached | 38' Detached | 45' Detached | Townhouse 20' | Rear Lane TH | Used (m) | Waste (m) |
|---|---|---|---|---|---|---|---|---|---|---|
| P1-001 | 103.74 | 1 | 101.89 | 4 | 4 | 101.26 | 0.63 | |||
| P1-002 | 160.97 | 1 | 159.12 | 13 | 2 | 158.40 | 0.72 | |||
| P1-012 | 116.52 | 1 | 114.67 | 17 | 113.90 | 0.77 | ||||
| P1-013 | 106.98 | 1 | 105.13 | 15 | 105.10 | 0.03 | ||||
| P1-022 | 178.37 | 2 | 174.82 | 25 | 174.00 | 0.82 | ||||
| P1-029 | 359.03 | 2 | 355.48 | 20 | 9 | 355.44 | 0.04 | |||
| P1-032 | 180.98 | 2 | 177.43 | 7 | 7 | 177.21 | 0.22 | |||
| P1-050 | 150.51 | 1 | 148.66 | 12 | 2 | 148.00 | 0.66 | |||
| P1-065 | 85.39 | 2 | 81.84 | 12 | 81.00 | 0.84 | ||||
| 56 more blocks | ||||||||||
| Total | 8,747.42 | 8,581.27 | 170 | 194 | 169 | 203 | 111 | 8,509.71 | 71.54 | |
From the Concept A workbook: 9 of its 65 blocks, and the totals.
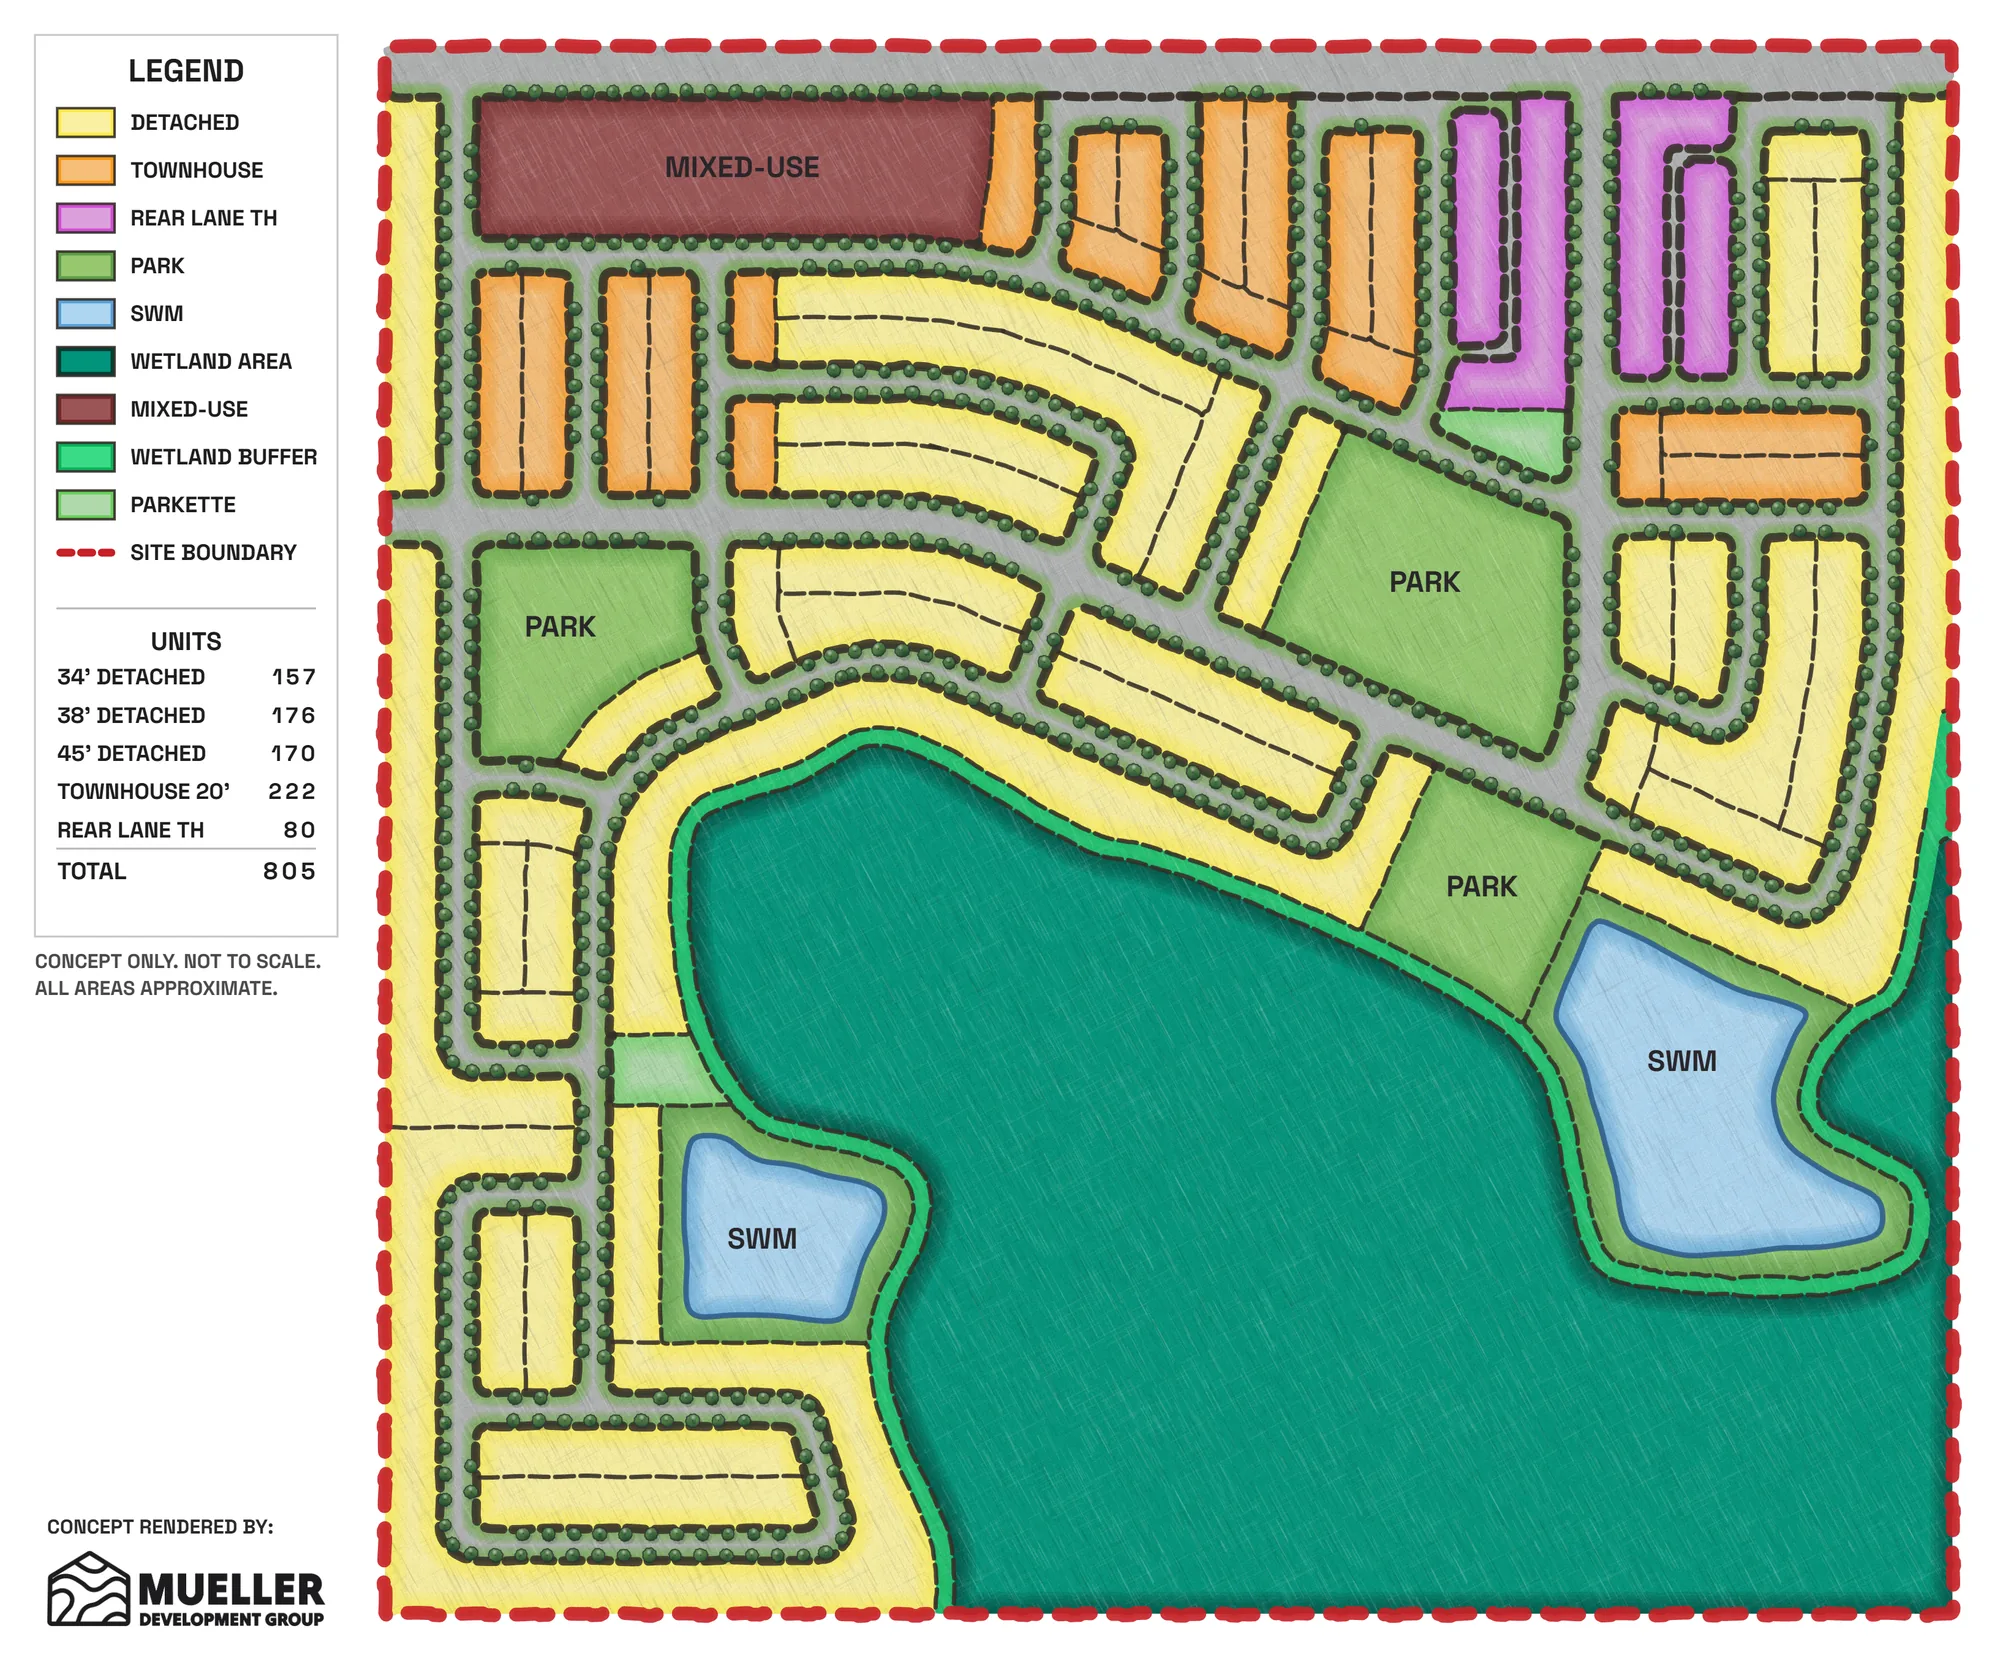
A mixed-use block replaces housing at the north-west corner, and the blocks beside it shift to townhouses.
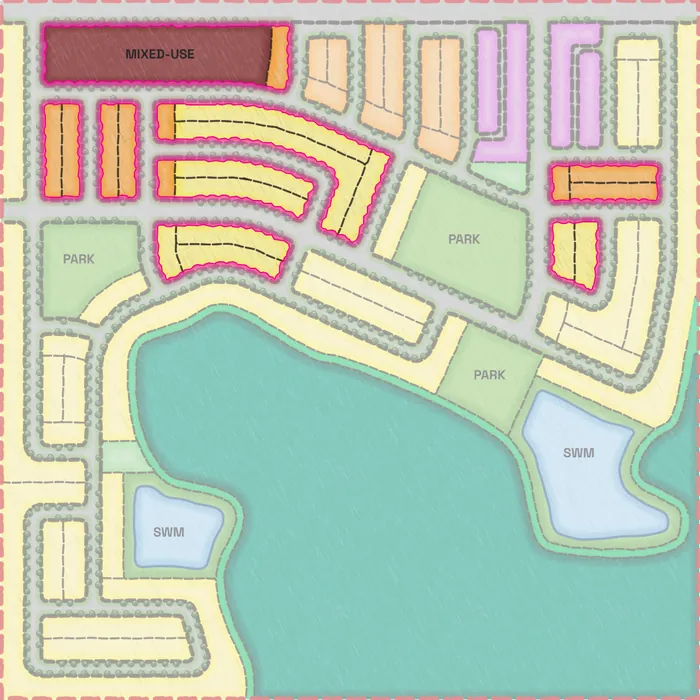
Changes vs Concept A.
Back-to-back townhouse blocks are added on the west side and in the north-east, lifting the total.
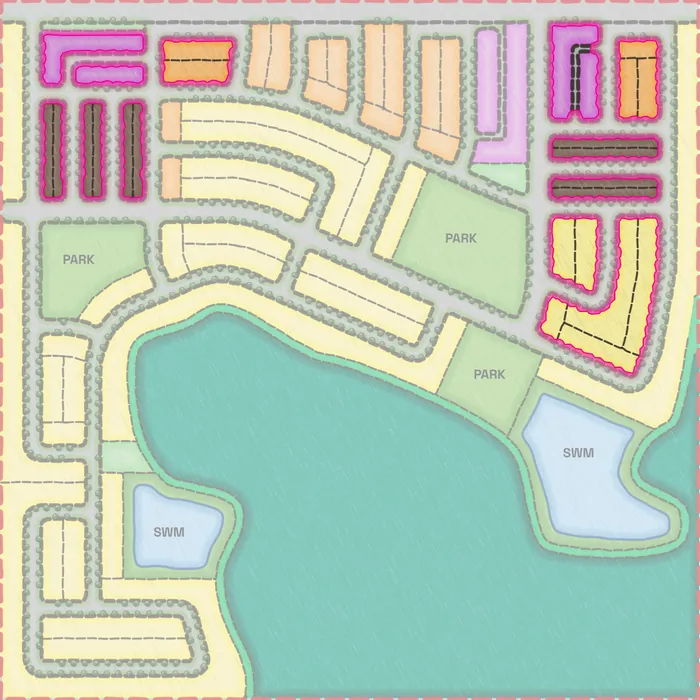
Changes vs Concept A.
When the layout stays as drafted, a re-run shows what a different product mix does to the count. In this example, Concept A1 is the base run. In Concept A2, the 38' Detached is dropped and a 27' Detached is added. The plan is the same, and the total goes from 847 to 903 units.
A re-run on the same blocks is $250. See pricing
847units
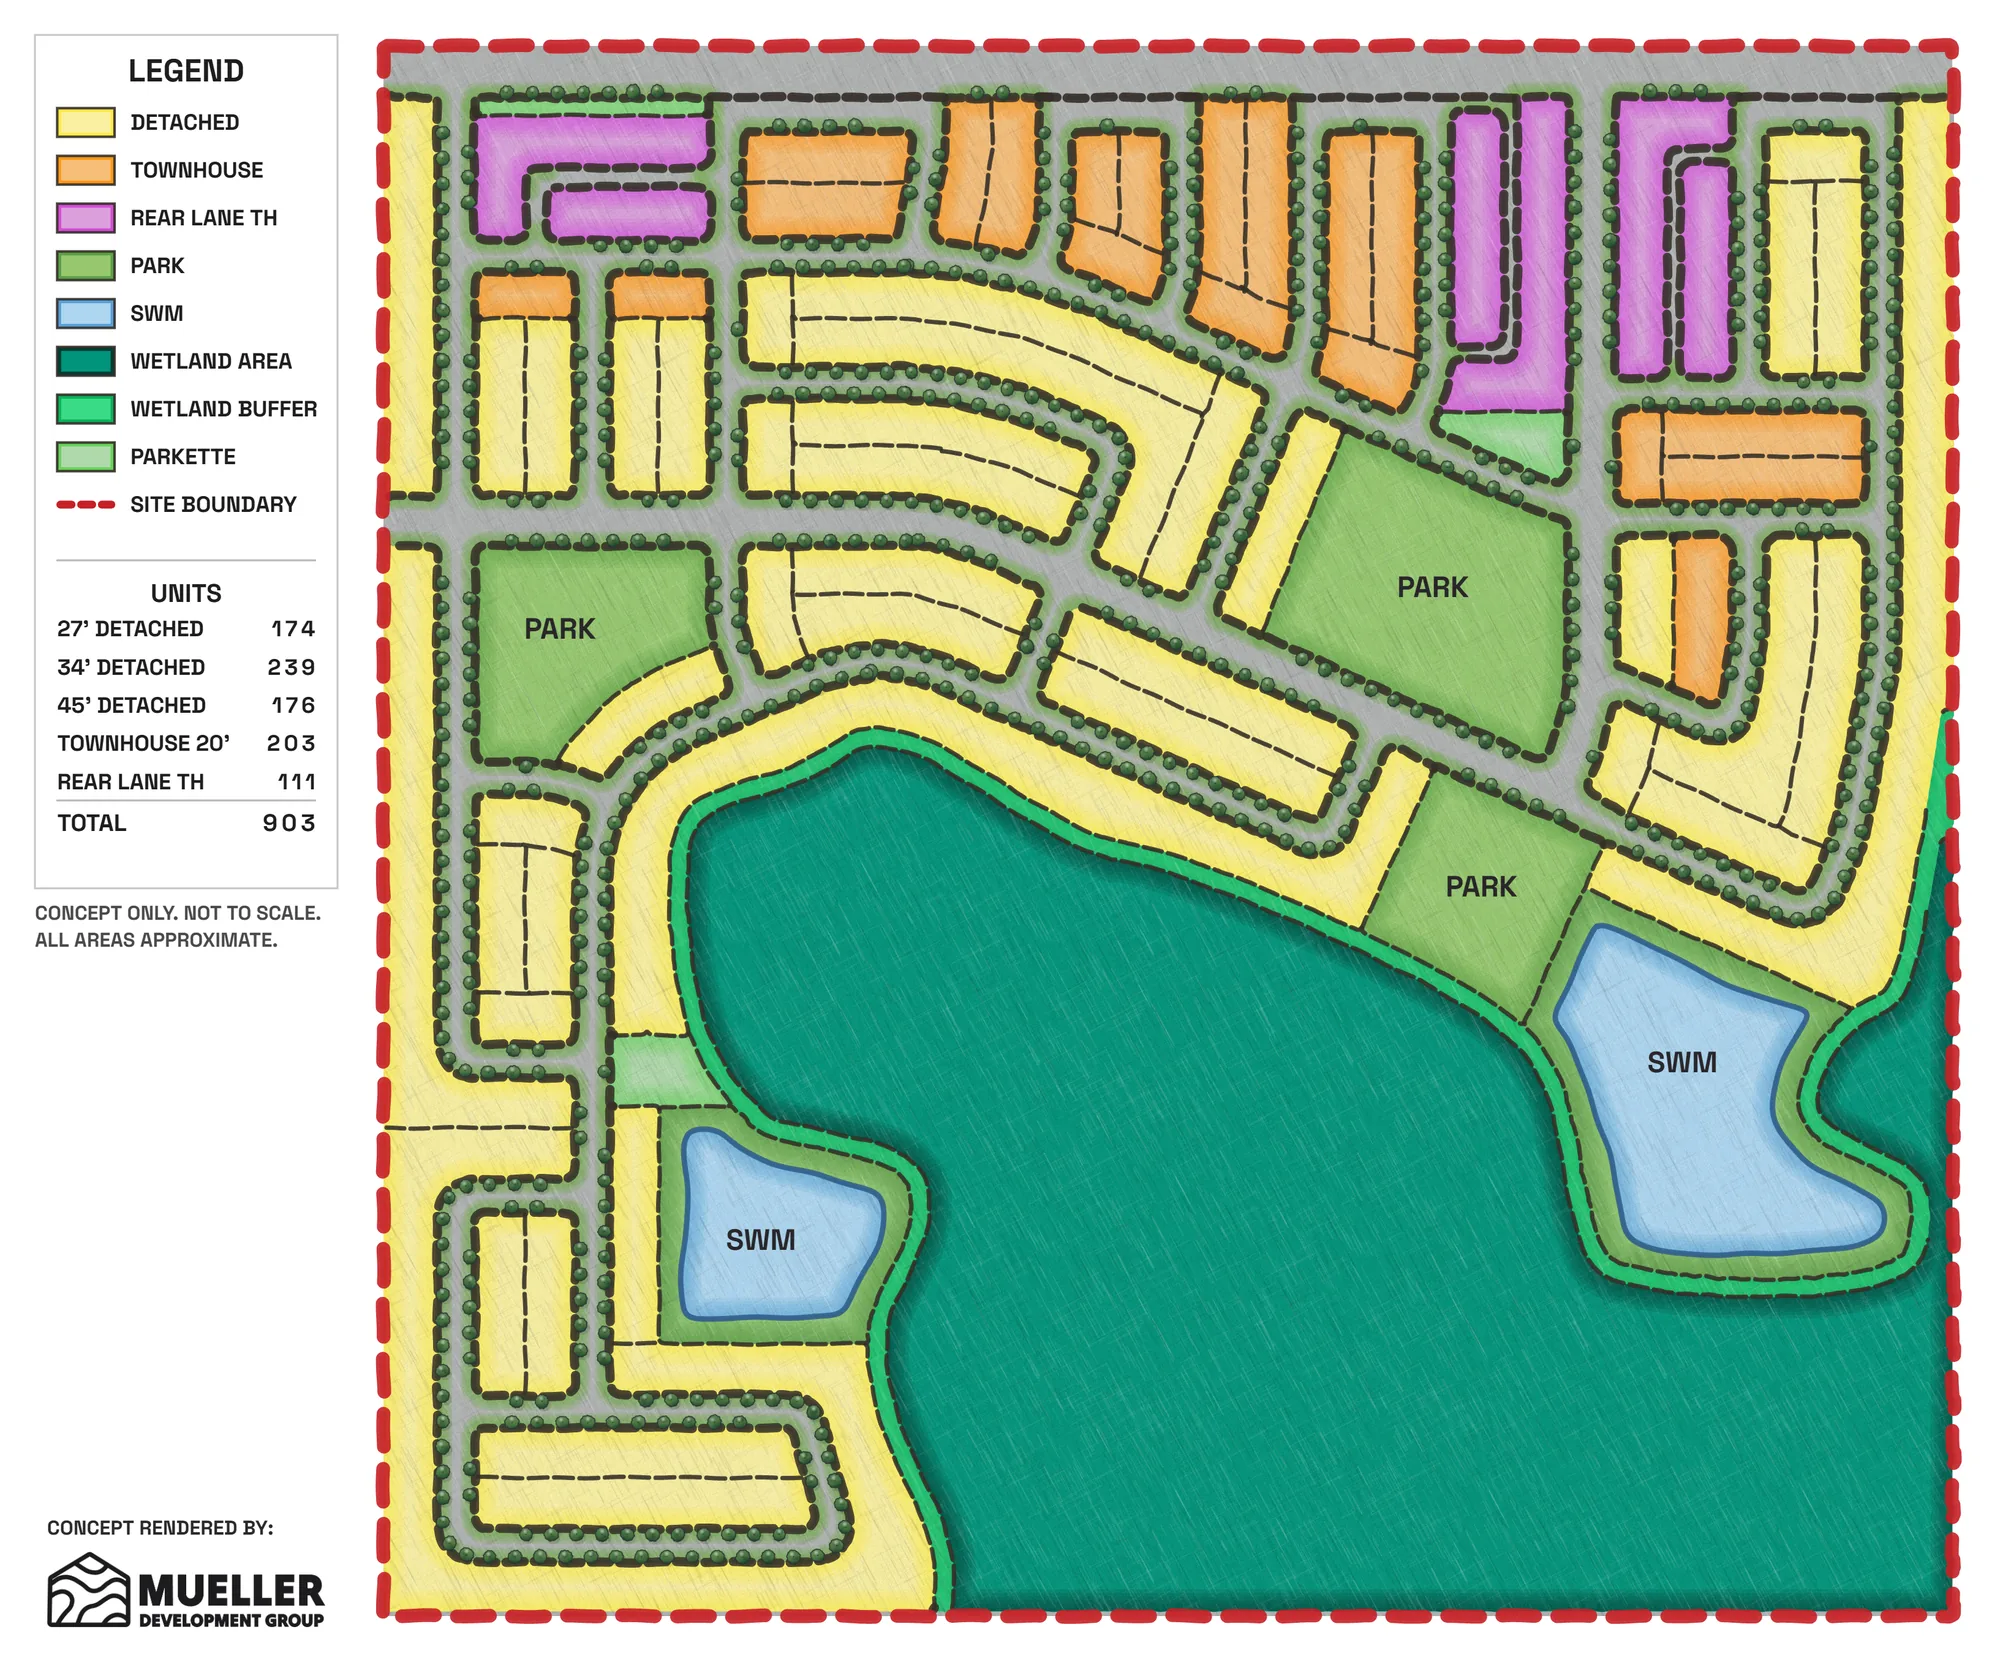
903units+56 vs first run
Note: Removal of 38' Det. Add 27' Detached for more distinct detached offering.
| Product | Concept A1 | Concept A2 - Remix | |||
|---|---|---|---|---|---|
| 27' Detached | – | 174 | 19% | +174 | |
| 34' Detached | 170 | 20% | 239 | 26% | +69 |
| 38' Detached | 194 | 23% | – | −194 | |
| 45' Detached | 169 | 20% | 176 | 19% | +7 |
| Townhouse 20' | 203 | 24% | 203 | 22% | |
| Rear Lane TH | 111 | 13% | 111 | 12% | |
| Total units | 847 | 903 | +56 | ||
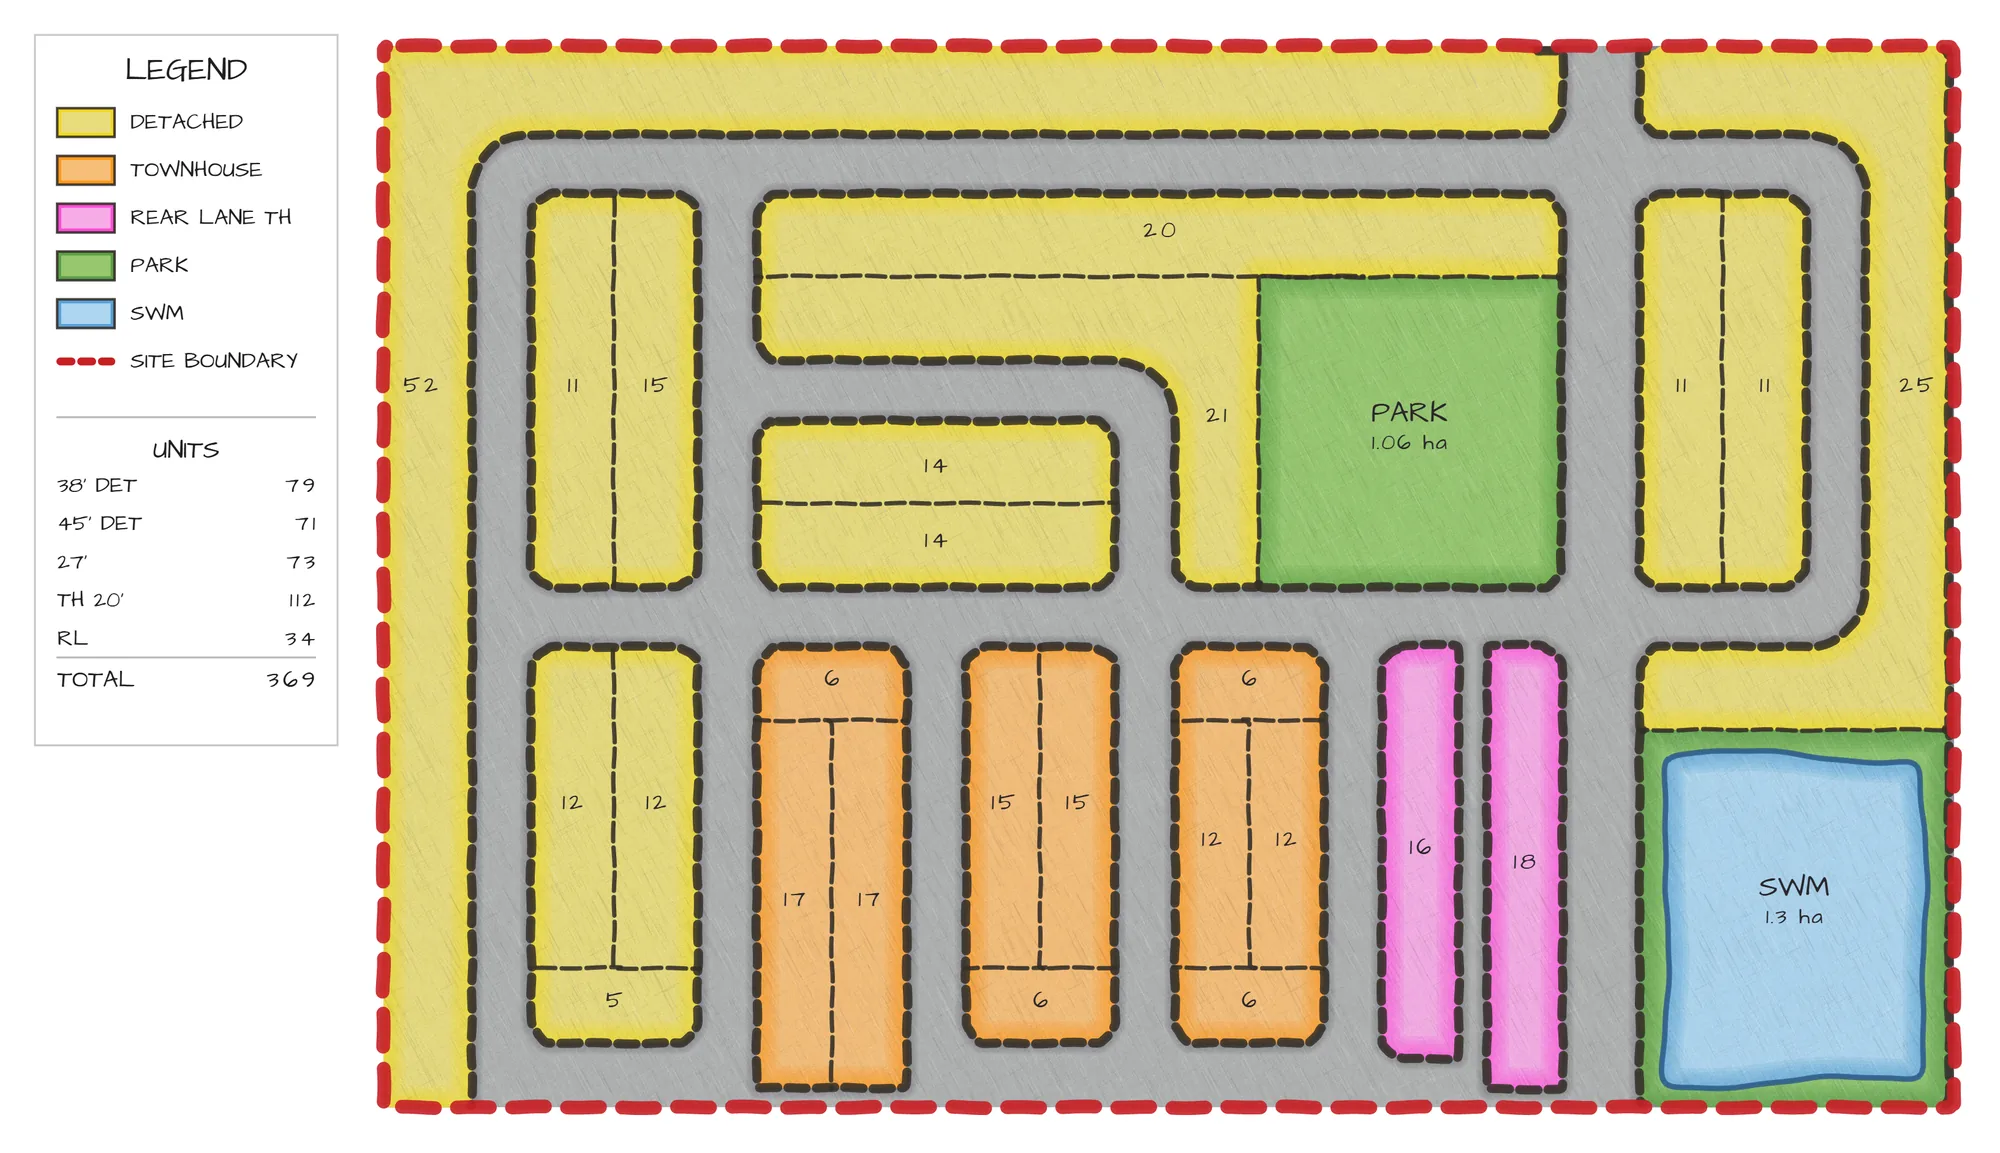
On a rendered plan, each block carries its unit count and the legend carries the totals. This one is a smaller site: 369 units across five products.
Renders are customizable. If your team is used to matching colours to products, prefers a particular lettering, or wants trees or unit counts left off the plan, we set it up that way. This plan and the three concepts on this page show two of those setups.
A short call comes first. Then share a concept and get it back lotted, rendered and ready to compare.